
Partial design process
Grade Level: 10 (9 – 11) Time Required: 1 hour Group Size: 2 Subject Areas:NGSS Performance Expectations:

Students learn how engineers characterize earthquakes through seismic data. Then, acting as engineers, they use real-world seismograph data and a tutorial/simulation accessed through the Earthquakes Living Lab to locate earthquake epicenters via triangulation and determine earthquake magnitudes. Student pairs examine seismic waves, S waves and P waves recorded on seismograms, measuring the key S-P interval. Students then determine the maximum S wave amplitudes in order to determine earthquake magnitude, a measure of the amount of energy released. Students consider how engineers might use and implement seismic data in their design work. A worksheet serves as a student guide for the activity. This engineering curriculum aligns to Next Generation Science Standards (NGSS).
Every year, earthquakes cause death and destruction worldwide. These natural disasters may be mitigated, however, by insightful and creative engineering. Engineers first determine where earthquakes are likely to occur, and how severe they are likely to be. They use three seismographs in a process called triangulation to determine earthquake epicenters. Using historical seismographs, engineers forecast the strength or magnitude of earthquakes and make predictions and determine building codes and safety protocols.
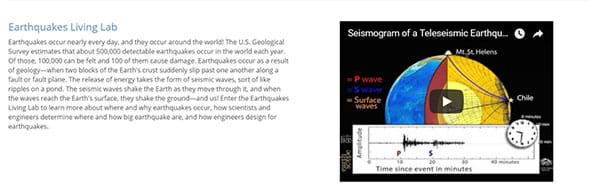
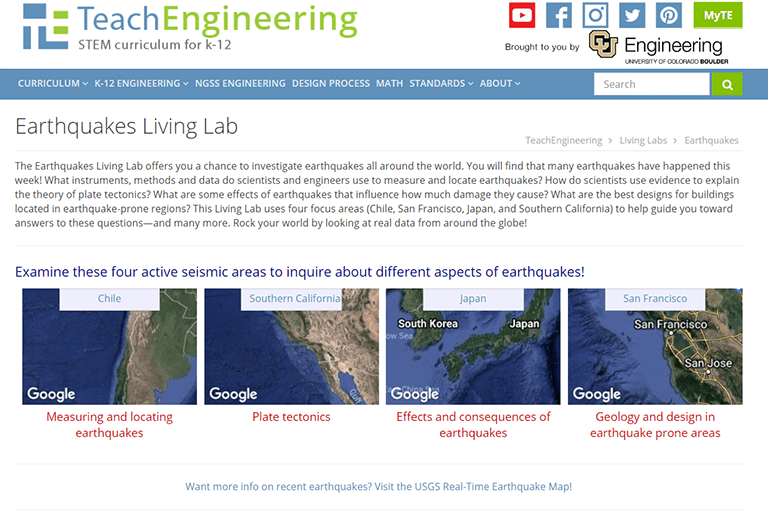
Scientists and engineers around the globe gather data through observation and experimentation and use it to describe and understand how the world works. The Earthquakes Living Lab gives students the chance to track earthquakes across the planet and examine where, why and how they are occurring. Using the real-world data in the living lab enables students and teachers to practice analyzing data to solve problems and answer questions, in much the same way that scientists and engineers do every day.
After this activity, students should be able to:
Each TeachEngineering lesson or activity is correlated to one or more K-12 science, technology, engineering or math (STEM) educational standards.
All 100,000+ K-12 STEM standards covered in TeachEngineering are collected, maintained and packaged by the Achievement Standards Network (ASN), a project of D2L (www.achievementstandards.org).
In the ASN, standards are hierarchically structured: first by source; e.g., by state; within source by type; e.g., science or mathematics; within type by subtype, then by grade, etc.
HS-PS4-1. Use mathematical representations to support a claim regarding relationships among the frequency, wavelength, and speed of waves traveling in various media. (Grades 9 - 12)
Do you agree with this alignment? Thanks for your feedback!
Alignment agreement: Thanks for your feedback!
Alignment agreement: Thanks for your feedback!
Alignment agreement: Thanks for your feedback!
MS-ESS3-2. Analyze and interpret data on natural hazards to forecast future catastrophic events and inform the development of technologies to mitigate their effects. (Grades 6 - 8)
Do you agree with this alignment? Thanks for your feedback!
Alignment agreement: Thanks for your feedback!
Alignment agreement: Thanks for your feedback!
Alignment agreement: Thanks for your feedback!
The uses of technologies and any limitations on their use are driven by individual or societal needs, desires, and values; by the findings of scientific research; and by differences in such factors as climate, natural resources, and economic conditions. Thus technology use varies from region to region and over time.
Alignment agreement: Thanks for your feedback!
Each group needs:
Visit [ www.teachengineering.org/activities/view/csm_findingepicenters_activity1 ] to print or download.
Seismographs are measuring devices designed by engineers and used by researchers to determine the locations and magnitudes of earthquakes. Several thousand seismographs exist at locations around the planet, continuously measuring abnormalities in the Earth's movement. Specifically, seismographs make recordings (seismograms) of the seismic waves generated from earthquakes, providing engineers and other researchers with data that they use to make predictions about future earthquakes.
What types of engineers might use this data the most? How might they use this information? (Listen to student ideas.) Civil engineers, who design houses, apartment buildings, schools, skyscrapers, bridges, highways, tunnels, water treatment facilities, factories and other structures, may use this data to help them create safer structures that are less likely to sustain damage during earthquakes. While no one can predict earthquakes, knowing the intensities, frequencies and locations of past earthquakes and fault planes helps us to better anticipate the locations and forces to expect, so we can do our best to prepare our communities and infrastructure to withstand them safely.
In this activity, students use an online simulation—Virtual Earthquake—that is accessible through the Earthquakes Living Lab interface, to locate the epicenter of an earthquake by making simple measurement on three seismograms, recordings of an earthquake's seismic waves detected by instruments (seismographs) far away from the earthquake. The process is called triangulation. Then from the same recordings they determine the earthquake's magnitude, an estimate of the amount of energy released during the earthquake. The point of origin of an earthquake is called its focus and the point on the Earth's surface directly above the focus is the epicenter.
Since the 1970s, the use of the Richter magnitude scale has largely been replaced in the scientific community by the moment magnitude scale (MMS). In the U.S., earthquake measurements under the MMS (those of magnitude 3.5 or higher) are still commonly erroneously referred to by the general public and media as being on the Richter scale, due to more familiarity with the Richter scale.
The Richter scale was created in the 1930s to assign a single number to quantify the energy released during earthquakes. It's a logarithmic scale from 1 to 10 with each succeeding level representing 10 times as much energy as the last. Today, most seismologists no longer follow Richter's original methodology because it does not give reliable results when applied to stronger earthquakes and it was not designed to use data from earthquakes recorded at epicentral distances greater than ~600 km.
The moment magnitude scale (MMS) was developed in the 1970s as a modification of the Richter scale and is better for measuring big earthquakes but less good for small ones. Even though the scale formulae are different, MMS retains the familiar continuum of magnitude values defined by the older scale. Thus, the Richter scale is used for measuring small earthquakes (3.5 M or less), while the moment magnitude scale is used for measuring stronger earthquakes (3.5 M or higher). The USGS now uses the MMS to estimate magnitudes for all modern large earthquakes.
For purposes of this activity, the least complicated and probably most accurate approach is to just use the term "magnitude," without needing to say "on the Richter scale" or "on the moment magnitude scale." To abbreviate, use the symbol M (a capital M, plain text, no sub/superscripts) expressed to the nearest 0.1. If less precision is desired, precede M with a tilde, such as "M ~7" or "magnitude ~6.8."
Before the Activity
With the Students
What is an earthquake?
What is a seismic wave?
What is the difference between S and P waves?
epicenter: A point on the Earth's surface that is directly above the place where the underground forces of an earthquake originate.
moment magnitude scale: Similar to the Richter scale, but replacing its use starting in the 1970s for more accuracy in measuring big earthquakes (magnitudes > 3.5) from greater distances. (Source: USGS, Wikipedia)
P wave: The first seismic wave of an earthquake. Short for "primary wave" or "pressure wave." It travels faster than the same earthquake's S wave (almost double the speed) and is similar to sound waves.
Richter magnitude scale: An earthquake measurement scale created in the 1930s to assign a single number to quantify the energy released during earthquakes. In this 1-to-10 logarithmic scale, each succeeding level representing 10 times as much energy as the last. The magnitude is the logarithm of the amplitude of the ground wave. Considered best for measuring small earthquakes (3.5 M or less). (Source: USGS, Wikipedia)
S wave: The second seismic wave of an earthquake. Short for "secondary wave" or "shear wave." It is slower than the same earthquake's P wave and cannot travel through liquids.
seismograph: An instrument that measures motions of the ground, including those of seismic waves generated by earthquakes. Also called seismometer. The instrument detects and documents the intensity, direction and duration of ground vibrations, which are used to determine the epicenters and strength/magnitudes of earthquakes or other seismic events.
S-P interval: The time interval between the arrivals of P and S waves.
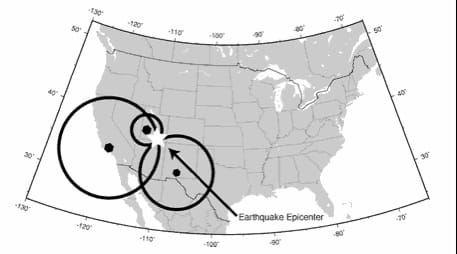
triangulation: A method to determine exactly where an earthquake originates. It is called triangulation because a triangle has three sides, and it takes three seismographs to locate an earthquake. If you draw a circle on a map around three different seismographs where the radius of each is the distance from that station to the earthquake, the intersection of those three circles is the epicenter. (Source: USGS)
Introduction: Before student pairs look at the Earthquakes Living Lab, direct them to complete the Engage section of the Finding Epicenters and Measuring Magnitudes Worksheet, which asks them to apply any prior knowledge and/or speculate as to what the Richter magnitude scale is and what an epicenter is. Review their answers to assess their base knowledge of the subject matter.
Activity Embedded Assessment
Triangulation and Magnitude: Student pairs complete the worksheet, which includes following a tutorial/simulation accessed through the Earthquakes Living Lab. Students first triangulate the location of an earthquake's epicenter, then calculate its magnitude. Have students turn in their answers for the Explain portion of the worksheet. Assess their understanding based on the thoroughness of their answers.
Sharing Information/Thinking Ahead: In the Evaluate section of the worksheet, student pairs are asked to compose answers to two questions—whether they think seismology is a reliable science and ways seismic data is useful for engineers. In a concluding class discussion, have groups share their ideas about engineering and one new thing they learned about earthquakes. Continue the discussion with the following questions (or assign these questions as homework):
Have student groups explore one or more of the other two regions (Southern California and Japan) provided in the Virtual Earthquake simulation.
Show students some of the numerous online animations comparing the movements of P and S waves.
Get the inside scoop on all things TeachEngineering such as new site features, curriculum updates, video releases, and more by signing up for our newsletter!
PS: We do not share personal information or emails with anyone. Subscribe to TE Newsletter
High School Activity
Earthquakes Living Lab: FAQs about P Waves, S Waves and MoreStudents learn what causes earthquakes, how we measure and locate them, and their effects and consequences. Through the online Earthquakes Living Lab, student pairs explore various types of seismic waves and the differences between shear waves and compressional waves.

Middle School Lesson
Seismic Waves: How Earthquakes Move Through the EarthStudents learn about the types of seismic waves produced by earthquakes and how they move through the Earth. Students learn how engineers build shake tables that simulate the ground motions of the Earth caused by seismic waves in order to test the seismic performance of buildings.

Upper Elementary Lesson
Earthquakes Rock!They make a model of a seismograph—a measuring device that records an earthquake on a seismogram. Students also investigate which structural designs are most likely to survive an earthquake.

Middle School Activity
Earthquakes Living Lab: Designing for DisasterStudents learn about factors that engineers take into consideration when designing buildings for earthquake-prone regions. Using online resources and simulations available through the Earthquakes Living Lab, students explore the consequences of subsurface ground type and building height on seismic d.

Moment magnitude scale. Last updated November 26, 2013. Wikipedia, The Free Encyclopedia. Accessed December 11, 2013. http://en.wikipedia.org/wiki/Moment_magnitude_scale
Novak, Gary. Virtual Earthquake (tutorial/simulation) 1996. Geology Labs On-Line, Department of Geological Sciences, California State University, Los Angeles, CA. Accessed December 11, 2013. http://www.sciencecourseware.com/virtualearthquake/
USGS Earthquake Magnitude Policy (implemented on January 18, 2002). Last modified July 18, 2012. U.S. Geological Survey, U.S. Department of the Interior. Accessed December 11, 2013. http://earthquake.usgs.gov/aboutus/docs/020204mag_policy.php
This activity is designed around the Earthquakes Living Lab, a resource and online interface that uses real-time U.S. Geological Survey seismic data from around the world. The living lab presents earthquake information through a focus on four active seismic areas and historic earthquakes in those areas. The real-world earthquake data is viewable via a graphical interface using a scaling map.
Last modified: May 8, 2020
Free K-12 standards-aligned STEM curriculum for educators everywhere.
Find more at TeachEngineering.org


Use of the TeachEngineering digital library and this website constitutes acceptance of our Terms of Use and Privacy Policy.
*The NGSS logo is a registered trademark of WestEd.
Neither WestEd nor the lead states and partners that developed the NGSS were
involved in the production of TE, and do not endorse it.